Exercise 1: Analyse with Key Influencers
Task 1: Create a Key Influencers Visual
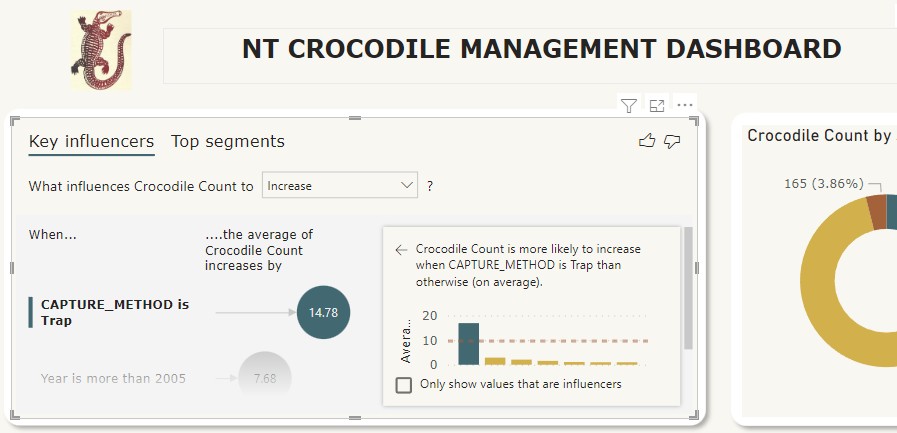
In this task, you will create a key influencers visual to assist with analysis of captures.
- Duplicate the Overview Tab and Rename this page Influencers.
- Select the Correlation visual on top left, and change this to a Key influencer
Visual. From the VISUALISATIONS panel select Key influencers visual - Click on the Focus mode to increase the size of the Key Influencers visual
- From FIELDS section, drag and drop % Female field from the General
Measures Table table to Analyse. - From FIELDS section, drag and drop Year field from All Captures table to
Expand by.
Note: Use Expand By to add fields you want to use for setting the level of the
analysis without looking for new influencers.
Task 2: Expand the Key Influencer Analysis (or Decomposition Tree if you have
an earlier Power BI version)
- Move fields that you think might influence into the Explain by field. You can
move as many fields as you want. In this case, try using :
a. Analyze by the Crocodile Count
b. As fields into the Explain By like the Year and Month_Name field from
Date table.
c. Add additional fields to Explain By

Here are a few questions to answer:
- What Capture data contributes to Captures increase?
- What Capture data contributes to Captures decrease?
- What Date data contributes to Captures increase?
What Year contributes to the highest Captures?