Exercise 1: Create a Measures table
This exercise helps you establish hands-on techniques and knowledge to navigate and
manage your measures effectively. You will have used the DAX language, to create measures
on the tables and columns from your datasets. Public and organizational datasets have a
wealth of different calculations that can be created just from a single column value.
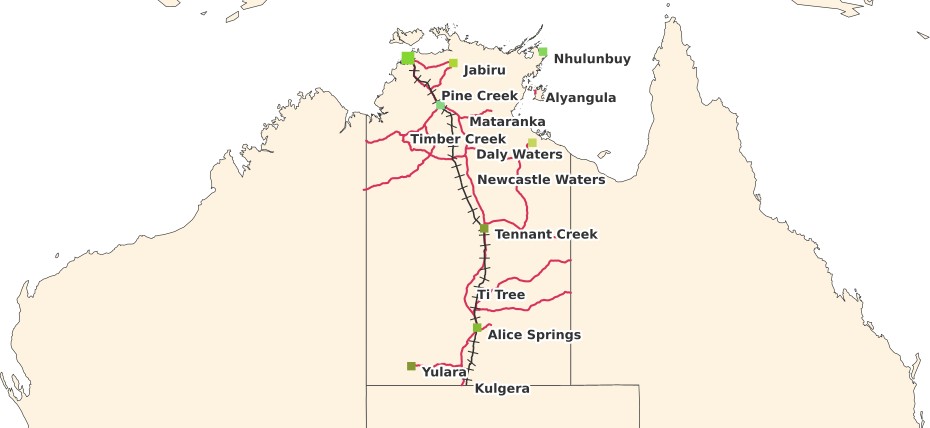
Real NT Public Data
Skills in DAX are essential in being able to create meaningful calculations about your data.
However, developing good habits early on will be the difference between good Power BI
reports and outstanding Power BI reports. Power BI gives you powerful features that allow
you to manage your measures so that they are manageable, easy to maintain and simple for
a business user to navigate
Simply the management and business experience in your DAX Calculations
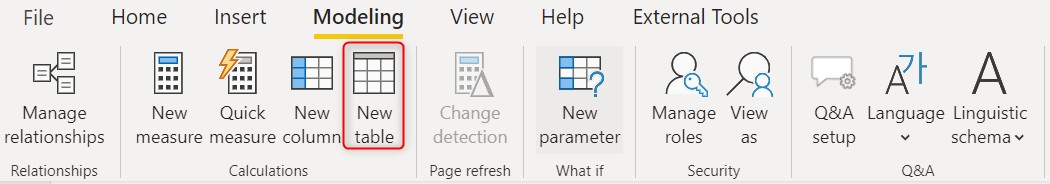
- From the RIBBON under Modelling > Calculations select New Table.
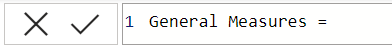
2.From the CALCULATION section, name the table “General Measures” and click the
checkmark.
3. You should now see a new table in the FIELDS section named “General Measures”. Your
measures table is presented with calculator icon overlaid on a table icon). This is slightly
different to a calculated column (sum icon overlaid on a table icon) or a measure (calculator
icon).
4. Managing your Measures table and the measures that go in it is best done in the Model
View where the relationships are maintained. From FIELDS section, click on one of the
measures you created in the Calculations Module, for example: Crocodile Count or Zone
Count (Measures are presented with calculator icon).
5. Managing your Measures table and the measures that go in it is best done in the Model
View where the relationships are maintained. Once in the properties section for a column in
Power BI in 2 Days: Lab 03 ©2022 Cloudstreet Consulting. All rights reserved 6
Model View you will be able to select the Home Table for your measure. This will move your
measure to the General Measures table.
*Note also that you are able to set a lot of other properties for your measure here which is
why managing your measure in Model View is so good. Other properties that you can set
are:
- Description – Stores Metadata/Business Glossary/Data Dictionary information about
your measure - Synonyms – Feeds the QnA visual engine to provide alternative ways to refer to your
measure in language - Display Folder – Creates an another layer or folder for you to store your measures
within the Measures table - Formatting – Control the data type that your measure uses, hidden property and
other settings like thousands separator and decimal places - Data Category – Is in the Advanced section and adds extra behaviours to your visuals
when data is categorised e.g. latitude and longitude.
6. Repeat these last two steps to move your other measures to your new General Measures.
Including: % Female, % Male, Crocodile Count, Female Crocodile Count, Male Crocodile
Count, Max Length Captured, Min Length Captured and Zone Count.
Note: If this process throws an error for any of your calculations, edit them to make sure the
reference the new General Measures instead of their original table.
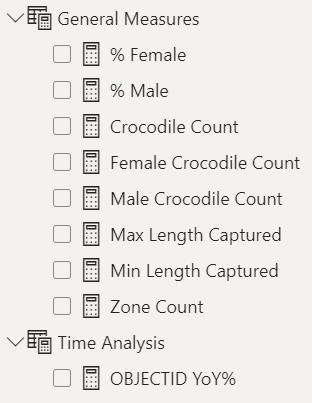
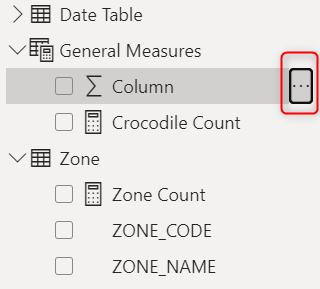
7. From FIELDS section, notice that under new General Measure table, there is an empty
Column, right click on 3 dots > Select Hide. Notice the table is moved up to the top. This
helps you easier to navigate and manage your measures in the future.
- With the same technique, create a new Measure table titled “Time Analysis” and move
your YoY% measure to that table. The result should look something like this: