Exercise 5: Create interactivity with tooltipand bookmark
Level up your dashboard to communicate with audience by using tooltips and bookmark
Task 1: Create a tooltip
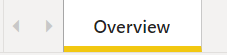
- Give your first page a name, such as Overview by double-clicking into the name.
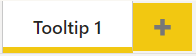
42. Create a new page by clicking the yellow “plus” sign at the bottom of the screen. Title this
tab “Tooltip 1”.
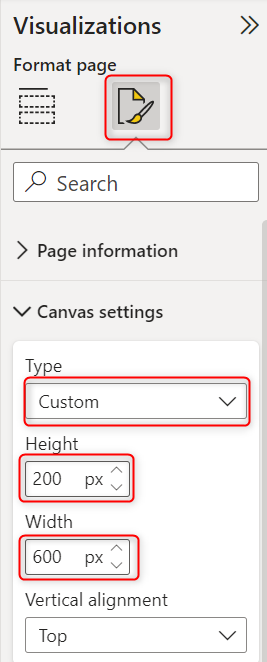
43. Under the Visualisations section, select “Format your report page” > Canvas settings >
Under Type select Custom, height: 200px and width: 600px
- You can zoom out your canvas by adjusting zoom area at the bottom right of the screen.
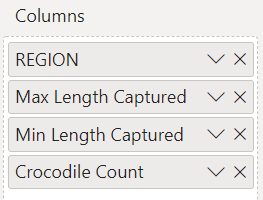
- Select Table under Visualisations. Then drag and drop Crocodile Count, Max Length
Captured and Min Length Captured field as well as REGION field.
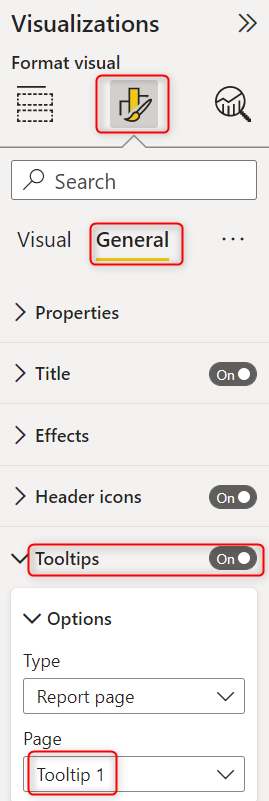
46. Go back to Overview page then select Max & Min Length Captured by Region chart.
47. Under Visualisations > Select “Format your visual” > General > Turn on Tooltips > Under
Options choose page Tooltip 1
48.Hover over the columns in “Max & Min Length Captured by Region” chart, you can see
the tooltip representing specific data for each region
Task 2: Create a bookmark
This is a powerful function that help the reporter creates a navigation and story for his/her
audience. In this exercise we will create a guideline that helps audience understand what are
involved in the dashboard
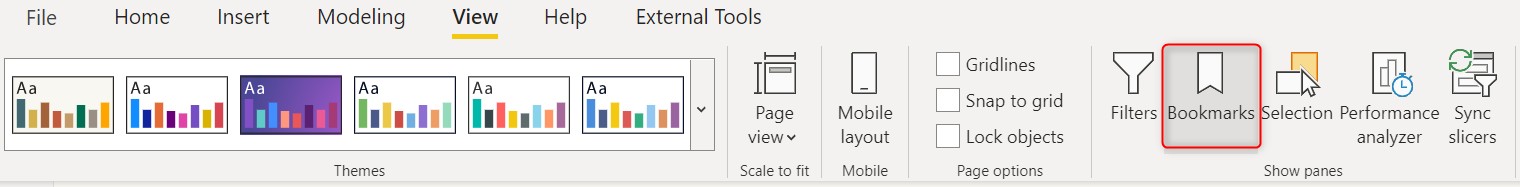
- Under View RIBBON, select Bookmarks. Notice next to Canvas, there is a Bookmark panel.
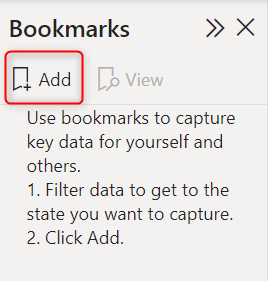
50. Working with bookmarks, we need 4 things:
- 2 actions to invoke the bookmarks, and
- 2 page destination as the result of these above actions.
Select Add to add new destination,
51.Rename it to “Open Guideline
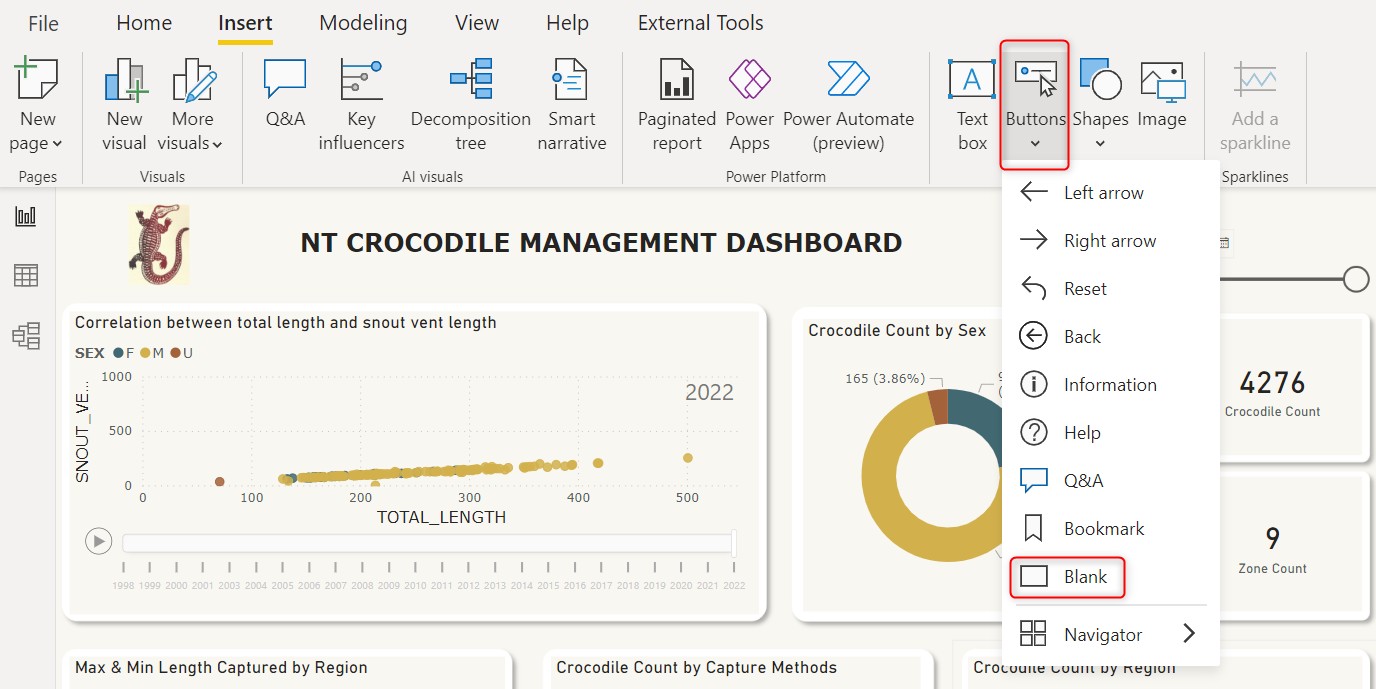
52.Under Insert RIBBON, Select Buttons > Blank.
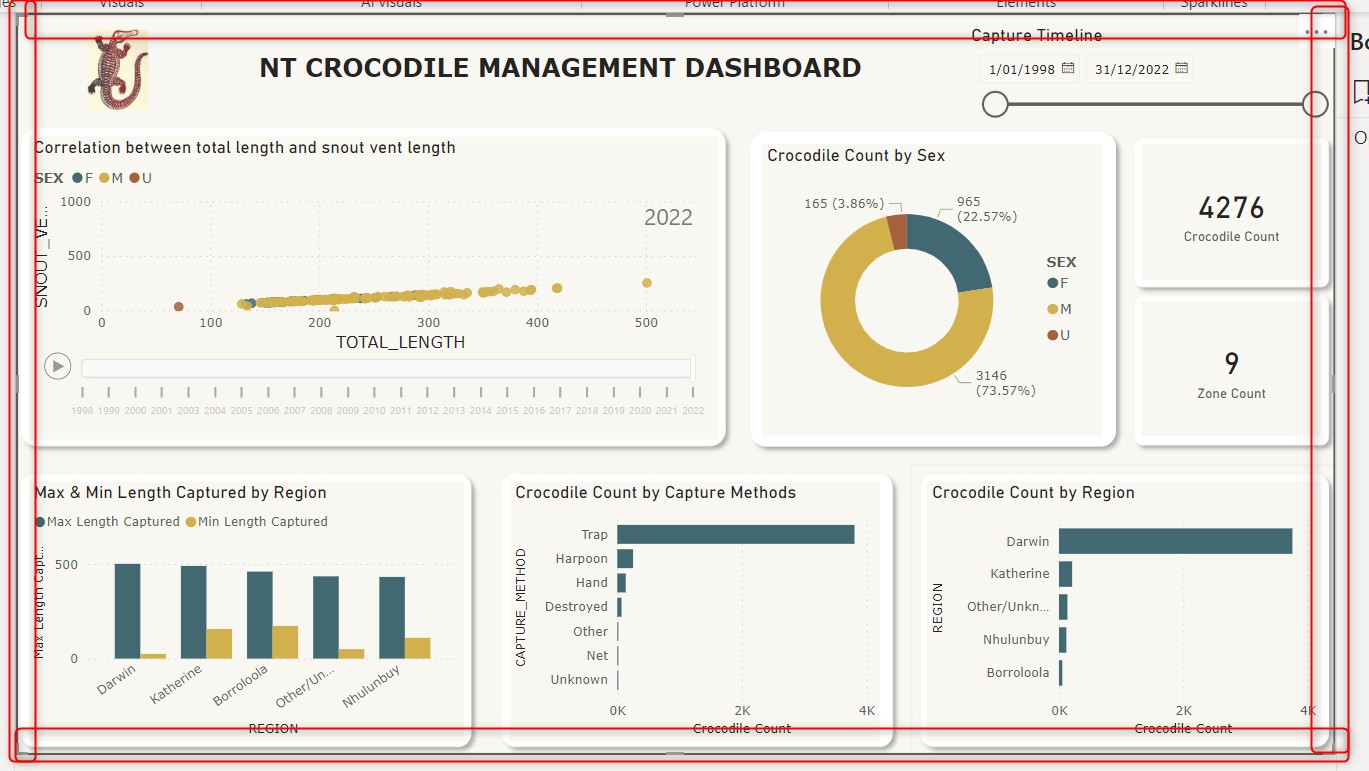
53.Adjust the size of the blank box to fit the whole canvas
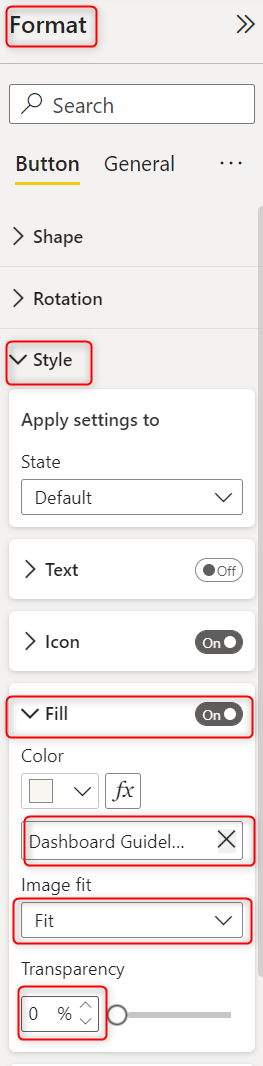
- Select the blank box > Format > Button > Style > Turn on Fill > Browse > Locate to
“Dashboard Guideline.png” > Fit Image and Transparency to 0%. Also turn off Border.
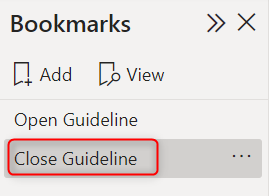
- Open again Bookmarks, Add another destination, name it “Close Guideline”.
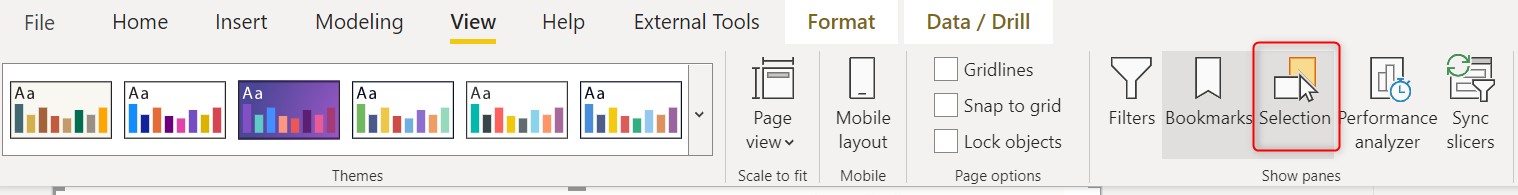
56. Under View RIBBON, select Selection. This is a place where you can hide or unhide
elements of your dashboard, it will be useful for your bookmarks.
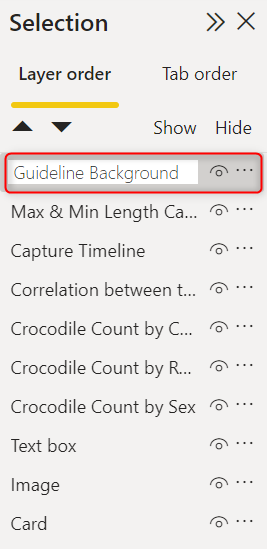
57. Under Selection, change the name “Button” to “Guideline Background” to avoid
confusion by double-clicking it
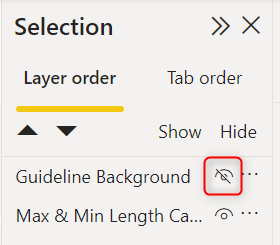
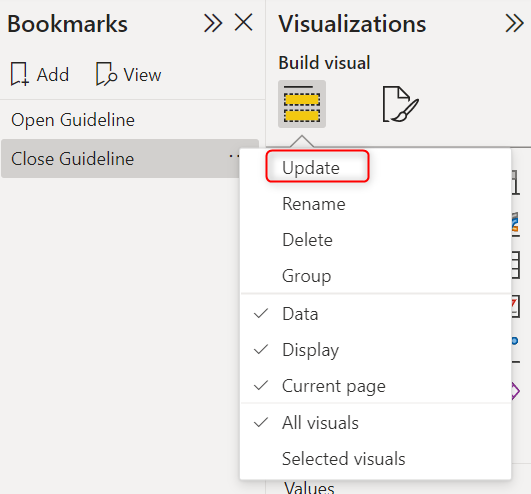
58. Under Bookmarks, select “Close Guideline”. When technically closing guidelines, the
Guideline Background under the Selection section should be hidden by clicking on the eye icon
59.. Right-click on Close Guideline and select Update.
60. Navigate to the Overview page, you should see main dashboard now. We will take the
Crocodile icon to open our guideline.
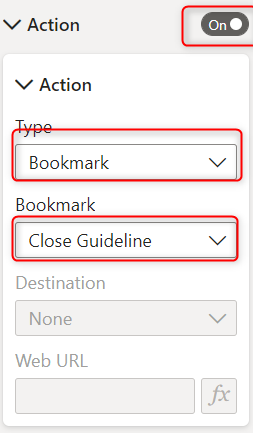
61. Click Crocodile icon, on the right hand side under Format > Turn in Action > Type
Bookmark > Bookmark Open Guideline.
62. Now it leads you to the faded guideline background, select the background > Format >
Turn on Action > Bookmark and Close Guideline