Prep 1: The Key Influencers visual
The Key Influencers visual in Power BI Desktop allows you to identify and analyse the
factors that influence a particular outcome or target variable. You start by selecting a
target variable or outcome of interest, such as captures, sales, revenue, or
customer churn.
- The Key Influencers visual automatically analyses the relationship between the
target variable and other fields in the dataset, such as class, zone, or other
dimensions - The visual displays a list of fields that have the most significant impact on the
target variable based on statistical analysis and machine learning algorithms. - Each influencing field is presented as a tile, showing the strength and direction
of the relationship with the target variable. - The tiles provide information such as the percentage of influence, the
contribution to the target variable, and a visual representation of the impact. - You can interact with the visual by selecting different influencing fields to
further explore the relationship and drill down into specific segments or
categories. - The Key Influencers visual supports various filtering options, allowing you to
refine the analysis by applying filters to specific dimensions or subsets of data. - Additionally, you can adjust the settings of the visual, such as the number of
influencers displayed, the confidence level, and the type of analysis used (e.g.,
association rules or decision trees). - The insights gained from the Key Influencers visual can inform decision-making, strategy development, and targeted interventions to optimize
outcomes or address influential factors. - The visual provides an interactive and intuitive way to uncover hidden
patterns, identify drivers of performance, and make data-driven decisions
based on the factors that impact the target variable the most.
The key influencers visual helps you understand the factors that drive a metric you’re
interested in. It analyses your data, ranks the factors that matter and displays them
as key influencers. For example, suppose you want to figure out what influences
employee turnover, which is also known as churn. One factor might be employment
contract length, and another factor might be commute time.
When to use key influencers
The key influencers visual is a great choice if you want to: - See which factors affect the metric being analyzed.
- Contrast the relative importance of these factors. For example, do short-term captures affect churn more than long-term captures?
Features of the key influencer’s visual
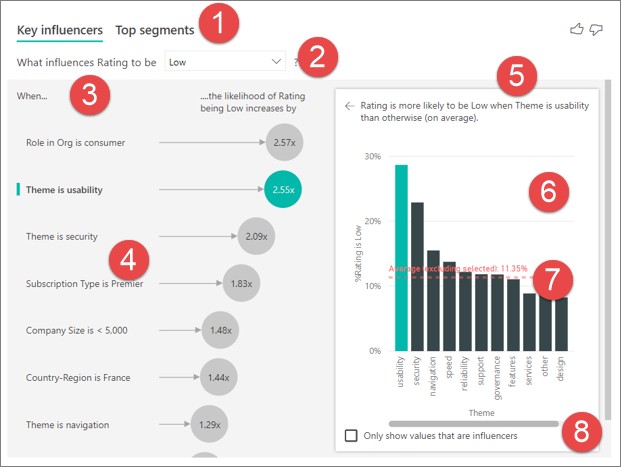
- Tabs: Select a tab to switch between views. Key influencers show you
the top contributors to the selected metric value. Top segments show
you the top segments that contribute to the selected metric value.
A segment is made up of a combination of values. For example, one
segment might be consumers who have been customers for at least 20
years and live in the west region. - Drop-down box: The value of the metric under investigation. In this
example, look at the metric Rating. The selected value is Low. - Restatement: It helps you interpret the visual in the left pane.
- Left pane: The left pane contains one visual. In this case, the left pane
shows a list of the top key influencers. - Restatement: It helps you interpret the visual in the right pane.
- Right pane: The right pane contains one visual. In this case, the column
chart displays all the values for the key influencer Theme that was
selected in the left pane. The specific value of usability from the left
pane is shown in green. All the other values for Theme are shown in
black. - Average line: The average is calculated for all possible values
for Theme except usability (which is the selected influencer). So the
calculation applies to all the values in black. It tells you what percentage
of the other Themes had a low rating. In this case 11.35% had a low
rating (shown by the dotted line). - Check box: Filters out the visual in the right pane to only show values
that are influencers for that field. In this example, the visual is filtered to
display usability, security, and navigation