Task 1: Interpret categorical influencers
Top single factor that influences the likelihood of a low rating
The customer in this example can have three roles: consumer, administrator, and publisher. Being a consumer is the top factor that contributes to a low rating.
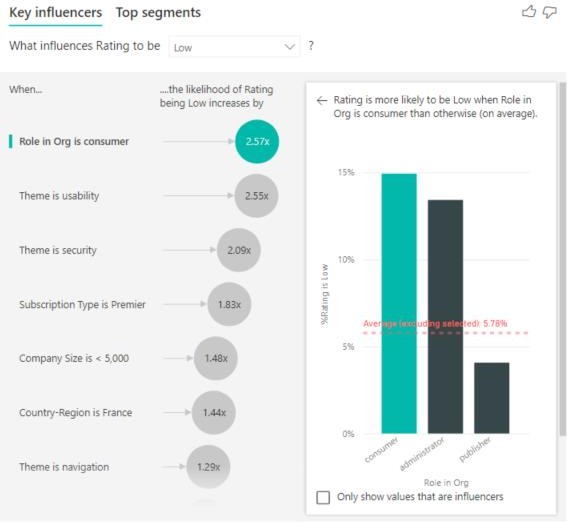
More precisely, your consumers are 2.57 times more likely to give your service a negative score. The key influencers chart lists Role in Org is consumer first in the list on the left. By selecting Role in Org is consumer, Power BI shows more details in the right pane. The comparative effect of each role on the likelihood of a low rating is shown.
- 14.93% of consumers give a low score.
- On average, all other roles give a low score 5.78% of the time.
- Consumers are 2.57 times more likely to give a low score compared to all
other roles. You can determine this score by dividing the green bar by
the red dotted line
Second single factor that influences the likelihood of a low rating
The key influencers visual compares and ranks factors from many different variables.
The second influencer has nothing to do with Role in Org. Select the second influencer in the list, which is Theme is usability.
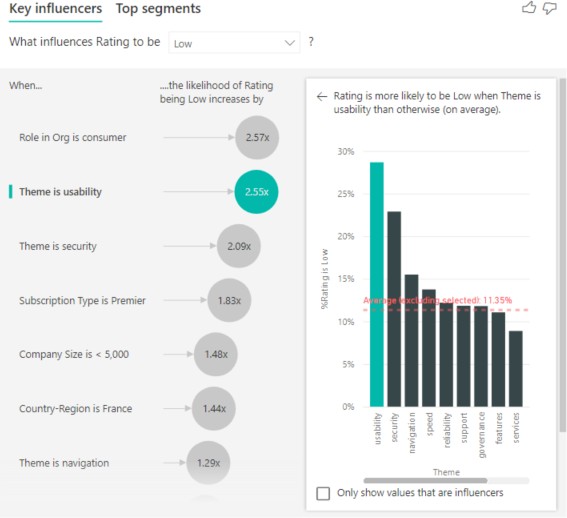
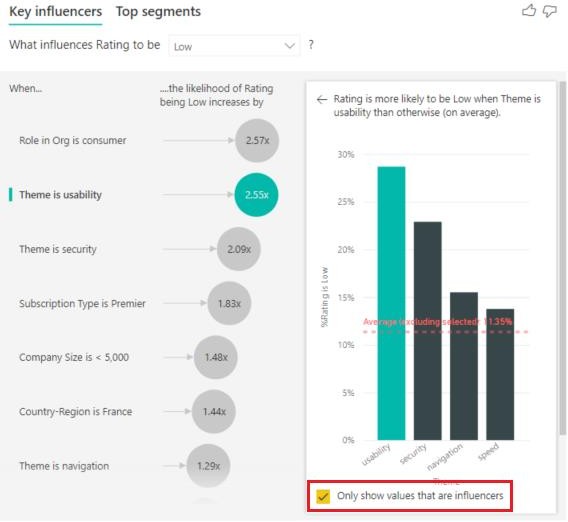
The second most important factor is related to the theme of the customer’s review. Customers who commented about the usability of the product were 2.55 times more likely to give a low score compared to customers who commented on other themes, such as reliability, design, or speed. Between the visuals, the average, which is shown by the red dotted line, changed from 5.78% to 11.35%. The average is dynamic because it’s based on the average of all other values. For the first influencer, the average excluded the customer role. For the second influencer, it excluded the usability theme. Select the Only show values that are influencers check box to filter by using only the influential values. In this case, they’re the roles that drive a low score. 12 themes are reduced to the four that Power BI identified as the themes that drive low ratings.
Interact with other visuals
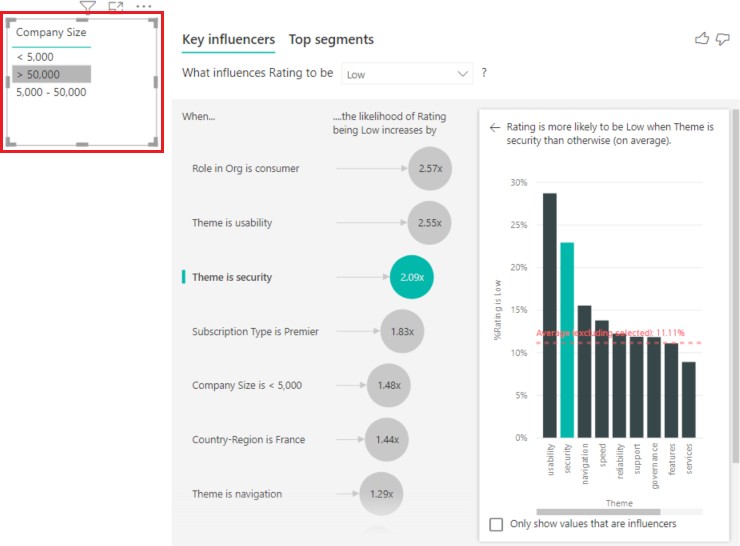
Every time you select a slicer, filter, or other visual on the canvas, the key influencers visual reruns its analysis on the new portion of data. For example, you can move Company Size into the report and use it as a slicer. Use it to see if the key
influencers for your enterprise customers are different than the general population. An enterprise company size is larger than 50,000 employees. Select >50,000 to rerun the analysis, and you can see that the influencers changed. For large enterprise customers, the top influencer for low ratings has a theme related to security. You might want to investigate further to see if there are specific security features your large customers are unhappy about.