Exercise 1: Build a Scatter chart
In this exercise, you will create a scatter chart.
1. Locate to Report preview, this is a canvas where you build your visual with your data.

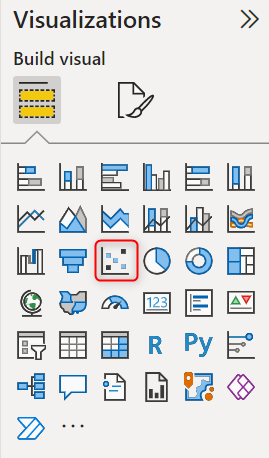
2. From the VISUALISATIONS panel select Scatter chart visual.
3. From FIELDS section, drag and drop TOTAL_LENGTH field from All Captures table to X Axis.
4. From FIELDS section, drag and drop SNOUT_VENT_LENGTH field from All Captures table to Y Axis.
5. Continue to drag and drop OBJECTID field to Values, SEX field to Legend.
6. From FIELDS section, drag and drop Year field from Date Table to Play Axis.
7. This provides a correlation between Total Length and Snout Vent Length among with Sex and Timeline.
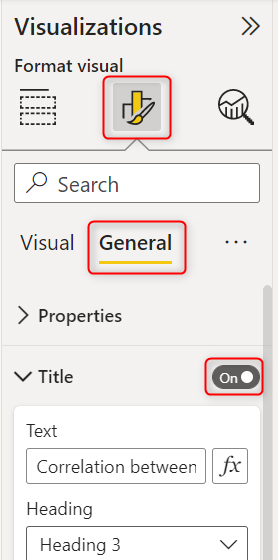
8. Give this chart a title, for example, “Correlation between total length and snout-vent length” by clicking on the chart, under Visualisation, select “Format your visual > General >
Turn on Title.