Exercise 2: Create Measures
In this exercise, you will create multiple measures using different methods.
Task 1: Calculate the Count of Crocodiles
- From Fields section, click on “All Captures” table. This ensures that the new measure is
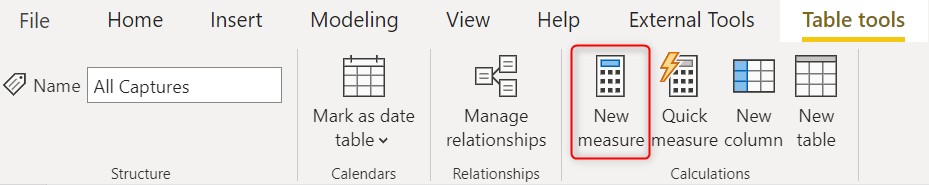
placed in this table. - From the Ribbon under Home > Calculations select New measure.
8. Create a measure titled Crocodile Count.
9. Use the DAX formula DISTINCTCOUNT and the OBJECTID field from the “All Captures”
table to create distinct count of crocodiles.

10. Notice that on the Field section, there is a new measure Crocodile Count with the
calculator icon in front. Notice the difference between this icon and the calculated column
icon.
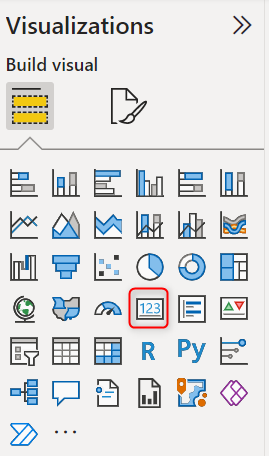
- In order to see the results of measure, we will use a set of multiple build visuals under
Visualisations section. For the results of this exercise, we will use Card visual. When you finish
creating a measure, select the Card icon, then drag the measure you just created into the card
Task 2: Calculate the Count of Zones
- With the same technique, we will count the zones where the crocodiles are spotted. On
the Fields section, right click on Zone table > New measure. - Give the new measure a name, like Zone Count then use DISTINCTCOUNT formula and
ZONE_CODE to create distinct count of zones.

13. Notice that on the Field section, under Zone table, there is a new measure Zone Count
with the calculator icon in front.
Task 3: Find the max and min length of captured crocodiles.
14. From Fields section, click on “All Captures” table. Select New Measure.
15.Use the DAX formula MAX and TOTAL_LENGTH field from the “All Captures” table to find
the max from all captured crocodiles.

16.With same technique, find the Min of captured crocodiles.

Task 4: CALCULATE – Count the total numbers of male and female crocodiles
17.From Fields section, click on “All Captures” table. Select New Measure.
18.Comparing to the techniques of finding distinct count of crocodiles and zones above,
now we need filter the data down or change the context to specific requirements, in this
case, is the sex of crocodiles, DAX formula CALCULATE is the most powerful formula to help
changing context in Power BI and it’s a bit like a SUMIF.
19.Still use DISTINCTCOUNT to count the number of crocodiles, however, use CALCULATE to
do the summing as it includes options to FILTER to narrow down the context of the
calculation to “M” and “F” along with SEX field.
20.Follow the syntax below.

21. Do the same for female crocodile count.

Task 5: DIVIDE – Calculate male and female percentage
22.We will use the measures we just created to calculate the percentages. From Fields
section, click on “All Captures” table. Select New Measure.
23.Use the DAX formula DIVIDE for doing proportions. It handles divide by 0 errors nicely.
Now create two % calculations using DIVIDE, with Male Crocodile Count as the numerator
and Crocodile Count as the denominator to find the percentage of male crocodiles to total
captures.

24.Do the same for female crocodile percentage
