Exercise 3: Dealing with Dates
The Date Table you created in the previous lab gives you the foundation date data to
organise and aggregate the data by a historical timeline and allows for data consistency as
well as the usage of DAX for Time Intelligence functions (YoY, MoM , etc.). AS outlined in the
PREP section, in order to make Date Table work, we need to inform Power BI that you will
use that table as date table.
- Scroll over to the right to where out Data Tables and Columns are located. Select “Date
Table” by clicking on its name. - From the RIBBON under Table Tools > Select the Mark as date table in the ribbon then
again select the Mark as date table option. The Date column selector pops up as Select
column. Select the “Date” column, note it is Validated successfully, then hit OK.

27.On the left-hand side, go to Model view. We need to join our Date Table to the All
Captures table.
28.On Date Table, click on Date column then drag it to DATE_CAPTURED in the All Captures
table. Once created you will see a line running showing the new relationship from the Date
Table to the All Captures table represented as a 1-to-many or (1 -> *) relationship.
29.Double click on that relationship or right click on the relationship line and select
Properties. Make sure the columns are correct – you should see your DATE_CAPTURED and
Date columns highlighted as the colour Grey, the cardinality shows Many to one, the Cross
filter direction shows Single and there is a tick beside Make this relationship active

It’s time to create some time measures.
Task 1: Count how many crocodiles in previous years
You wonder what the difference between the number of crocodiles is this year compared to
other years. The DAX function PREVIOUSYEAR will help you with that.
- From Fields section, click on “All Captures” table. Select New Measure. Give new measure
a title, like Pre Year Crocodile Count. - Use again Calculate DAX formula to change the context of filter, this time we change to
get previous year data. Follow the syntax below.

32.Lets now go to Report View and in the Visualisations section, select the Table icon then
make sure the Table is selected in Report View.

33. On the right-hand side Under the Date Table, select Year field.

34. Under All Captures table, select OBJECTID field and Pre-Year Crocodile Count measure

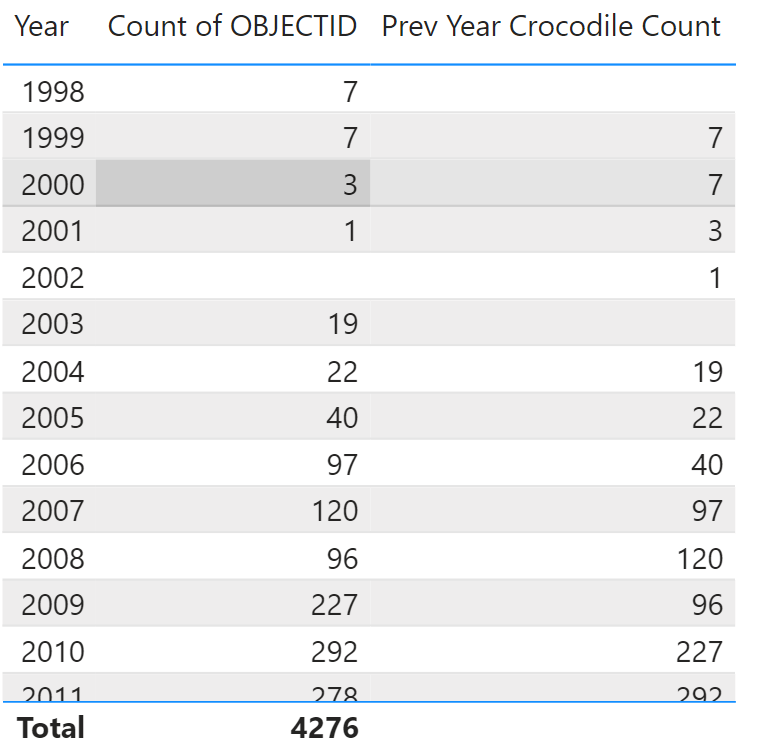
35. Now you will have a table with the original data and the data showing previous year for
that particular year.
Task 2: Calculate how many percentages of captured crocodiles year over year.
36. This task we will use Quick measure to generate new measure.
37. Select All Captures table in Fields section.
38. Under ribbon Table tools > Calculations select Quick measure.

39. In Calculation field, choose Year-over-year change under Time intelligence.

40.Base value will be OBJECTID from All Captures table, it will transfer to Count of OBJECTID.
41.Date will be Date column from Date table.
42.The result should be like the picture below. Hit OK.

43. Notice that in the Fields section, there is a new measure called OBJECTID YoY%.
Click on the measure and notice the code that Quick Measure created for us. Without having
advanced knowledge of DAX we were still able to create an intermediate calculation using
the PREVIOUSYEAR function.

44. If you haven’t already rename your new Quick Measure to just YoY% then select and drag
it to the table we just created above.
45. Now you can see the difference of crocodile counts through the period. Look at 2003 and
notice 2004 went up by 3 from 19 to 22 or 3/19 which is 15.79%. If your calculation reads
15.79% that means you not only create the Quick Measure correctly, but you must have
successfully marked your Date table correctly and added it to your model correctly.

46.Click save to save your report